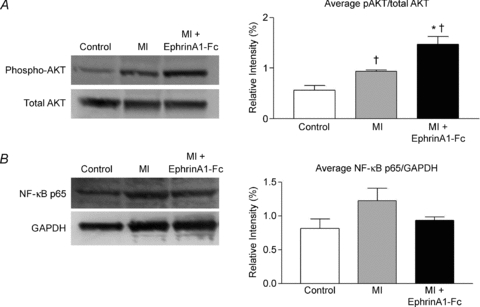
Figure 7. EphrinA1-Fc increases pAKT/AKT.

A, representative blot of phosphorylated and total AKT, with the average densitometric analysis of three repeated blots. n = 3 control, n = 3 MI, n = 3 ephrinA1-Fc. P < 0.05: †different from control, *different from MI. B, representative blot of NF-κB p65 protein expression, normalized to GAPDH. n = 3 control, n = 3 MI, n = 3 ephrinA1-Fc.
