
Figure 1. Opposite voltage-dependent effects of acetylcholine (ACh) and pilocarpine (Pilo) on M2R activation of IKACh recorded in atrial myocytes.
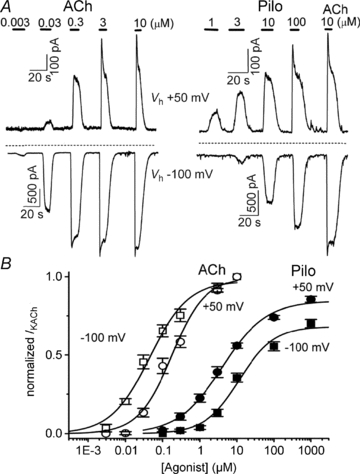
A, the effects of increasing concentrations of ACh and Pilo on IKACh recorded from feline atrial myocytes at a holding potential (Vh) of +50 mV (top traces) and −100 mV (bottom traces). Horizontal bars indicate the duration of ligand application. The dashed line indicates the zero current level. B, concentration–response curves for ACh (open symbols) and Pilo (filled symbols) activation of IKACh at Vh+50 mV (circles) and −100 mV (squares). Data were normalized to current elicited by a saturating concentration of ACh (10 μm) and plotted as a function of ligand concentration. The lines represent data fits to a Hill equation. The EC50 and Hill coefficient for ACh were 45 ± 10 nm and 0.8 ± 0.1 (Vh−100 mV) and 176 ± 39 nm and 1.0 ± 0.2 (Vh+50 mV). The EC50 and Hill coefficient for Pilo were 12 ± 3 μm and 0.9 ± 0.2 (Vh−100 mV) and 4 ± 1 μm and 0.8 ± 0.1 (Vh+50 mV). n = 8–10 cells.