
Figure 5. Concentration–response for ACh-induced reduction in M2R gating current.
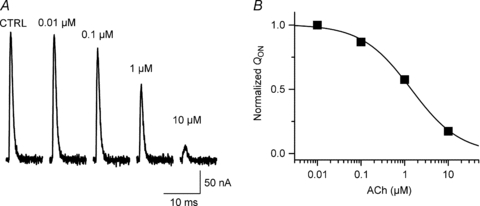
A, effect of indicated ACh concentration on M2R gating currents elicited by 20 ms step to +60 mV from Vh−70 mV, recorded in the cut-open oocyte voltage-clamp system. For clarity, only IgON is shown. B, normalized QONversus ACh concentration. Line represents data fit to Hill equation (concentration that caused 50% reduction in QON= 1.3 μm, Hill coefficient 0.8).