
Figure 7. Mutations in residues forming the putative ligand binding pocket alter the voltage dependence of M2R gating charge displacement.
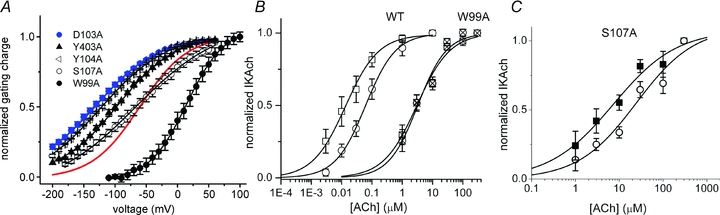
A, QON–V relationships for M2R mutants heterologously expressed in oocytes. Red line denotes WT M2R QON–V relationship. B, concentration–response for IKACh activation in HEK-293 cells heterologously expressing WT or mutant M2R and Kir3.1/3.4 channels. Concentration–response curves for WT M2R-mediated IKACh activation at Vh−100 mV (open squares) and +50 mV (open circles). The EC50 and Hill coefficient were 14 ± 3 nm and 0.8 ± 0.1 (Vh−100 mV) and 62 ± 6 nm and 0.9 ± 0.1 (Vh+50 mV). Concentration–response curves for W99A M2R-mediated IKACh activation at Vh−100 mV (hatched squares) and +30 mV (hatched circles). The EC50 and Hill coefficient were 3.0 ± 0.4 μm and 0.8 ± 0.1 (Vh−100 mV) and 3.2 ± 0.5 μm and 0.9 ± 0.1 (Vh+30 mV). Data points represent mean ± SEM of 4–8 cells. C, the potency of S107 M2R for ACh varies with membrane voltage. Concentration–response curves for S107A M2R-mediated IKACh activation in HEK-293 cells heterologously expressing S107A mutant M2R and Kir3.1/3.4 channels at Vh−100 mV (squares) and +50 mV (circles). The EC50 and Hill coefficient were 5.4 ± 1.0 μm and 0.7 ± 0.2 (Vh−100 mV) and 20.6 ± 4.6 μm and 0.7 ± 0.2 (Vh+50 mV). Data points represent mean ± SEM of 4–7 cells.