
Figure 8. Membrane surface expression of WT and mutant M2R as measured by oocyte chemiluminescence.
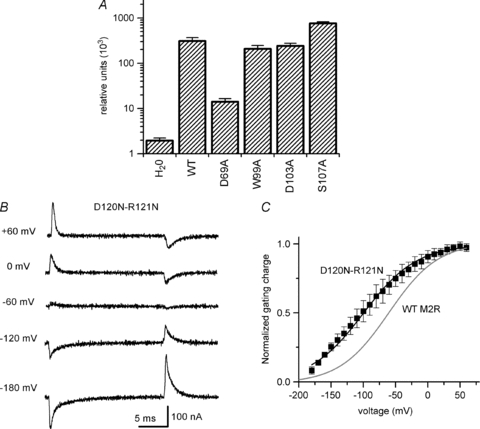
A, relative chemiluminescence of HA-tagged M2R (relative light units) expressed in oocytes. H2O represents signal from water-injected oocytes. The signal of oocytes expressing WT M2R-HA was approximately 150-fold greater than that of water-injected oocytes. The magnitude of D69A M2R-HA chemiluminescence represented only 5% of the signal generated by WT M2R-HA, indicating a marked reduction in mutant receptor cell surface expression. Data represent mean ± SEM, n = 10–16 oocytes. B, representative family of D120N-R121N M2R gating currents elicited by 20 ms voltage steps between −180 and +60 mV from a Vh of −70 mV using a P/–8 leak subtraction protocol at +60 mV. C, QON–V relationship for D120N-R121N M2R:V1/2−100 ± 4 mV, z 0.52 ± 0.04, n = 3. For comparison, the Boltzmann fit of the QON–V relationship for WT M2R is shown as a grey line.