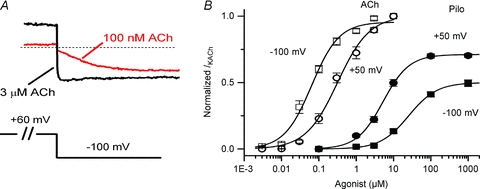
Figure 1. IKACh relaxation gating and opposite voltage-dependent IKACh modulation by ACh and Pilo.

A, examples of IKACh elicited by low and high ACh concentrations highlight the properties of relaxation gating. IKACh relaxation refers to a slow increase in current magnitude elicited by membrane hyperpolarization following a depolarizing pre-pulse (100 nm ACh, red trace). This time-dependent change in current is absent at saturating ACh concentrations (3 μm ACh, black trace). B, concentration–response curves for ACh (open symbols) and Pilo (filled symbols) activation of IKACh at Vh+50 mV (circles) and −100 mV (squares). Data were normalized to current elicited by a saturating concentration of ACh (10 μm) and plotted as a function of ligand concentration. The lines represent data fits to a Hill equation. The EC50 and Hill coefficient for ACh were 64 ± 10 nm and 1.1 ± 0.1 (Vh−100 mV) and 317 ± 49 nm and 1.0 ± 0.1 (Vh+50 mV). The EC50 and Hill coefficient for Pilo were 25.5 ± 2.6 μm and 1.1 ± 0.1 (Vh−100 mV) and 5.2 ± 0.7 μm and 1.2 ± 0.1 (Vh+50 mV). n = 10–14 cells.
