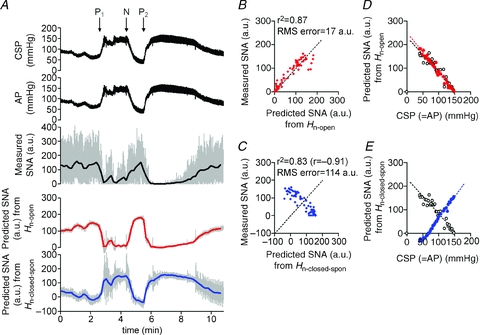
Figure 10. Predictability of neural arc transfer functions during pharmacological pressure interventions in closed-loop condition.

A, example of changes in CSP and AP (re-sampled at 10 Hz in the top and second panels, respectively) induced by pharmacological interventions and SNA responses (re-sampled at 10 and 0.1 Hz represented by grey and black lines, respectively, in third panel) in closed-loop baroreflex condition (protocol 5). Sequential bolus infusions of phenylephrine (P1), nitroprusside (N) and phenylephrine (P2) were administered. Using the open-loop (Hn-open, identified in protocol 1) and the closed-loop-spontaneous transfer functions (Hn-closed-spon, identified in protocol 2) of the neural arc, time-series of SNA output was predicted (re-sampled at 10 Hz represented by grey line, and at 0.1 Hz represented by red and blue lines in fourth and bottom panels, respectively) from the actual AP measured in protocol 5. SNA predicted by open-loop transfer function (Hn-open) appears to parallel the actually measured SNA, whereas SNA predicted by closed-loop-spontaneous transfer function (Hn-closed-spon) is markedly different from the measured SNA. B, scatter plot analysis of the SNA predicted by Hn-openversus the measured SNA. The identity line is shown. C, scatter plot analysis of the SNA predicted by Hn-closed-sponversus the measured SNA. D, relationship between CSP and SNA predicted by Hn-open (red filled circle, red broken line) is similar to that between CSP and actually measured SNA (open circle, black broken line) or E, relationship between CSP and SNA predicted by Hn-closed-spon (blue filled circle, blue broken line) is different from that between CSP and actually measured SNA (open circle, black broken line).
