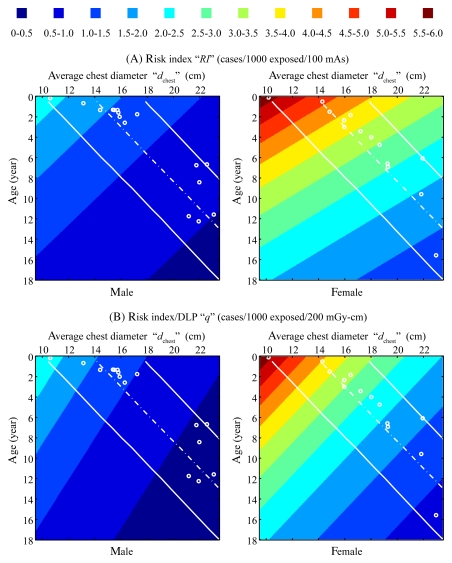
Figure 3:
Top: Risk index (RI), associated with protocol A, as a function of patient age and average chest diameter (dchest). Plotted risk index values were generated by using RI(dchest,age) = exp(αRIdchest +βRIage+γRI) with fitting parameters aRI, βRI, γRIfor protocol A (Table 4). Bottom: Risk index normalized by DLP (q), associated with protocol A, as a function of patient age and average chest diameter. Plotted q values were generated using q(dchest,age) = exp(αqdchest +βqage+γq) with fitting parameters aq, βq, γq for protocol A (Table 4). The unit of cases per 1000 cases per 200 mGy · cm was chosen such that the values in the top and bottom plots have a similar range. Dotted lines = mean chest diameter (and its 95% prediction interval [solid lines]) at each age calculated by using published thorax size data for pediatric CT patients (30). ○ = ages and average chest diameters of the 30 patients in this study.

