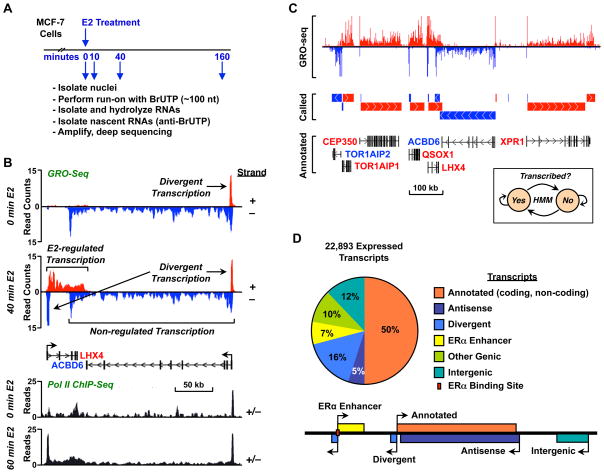
Figure 1. GRO-seq provides a detailed view of the E2-regulated transcriptome in MCF-7 cells.
(A) Overview of the experimental set up for GRO-seq analysis using MCF-7 cells.
(B) Genome browser view for a specific locus showing GRO-seq (top) and Pol II ChIP-seq (bottom) data illustrating the features of transcription and the effects of estrogen treatment.
(C) De novo detection of transcripts using GRO-seq data (top) and an HMM (inset). Called transcripts (middle) match well to RefSeq annotations (bottom).
(D) Classification of transcripts based on the annotation filter (Fig. S1, E and F).
See also Figure S1.

