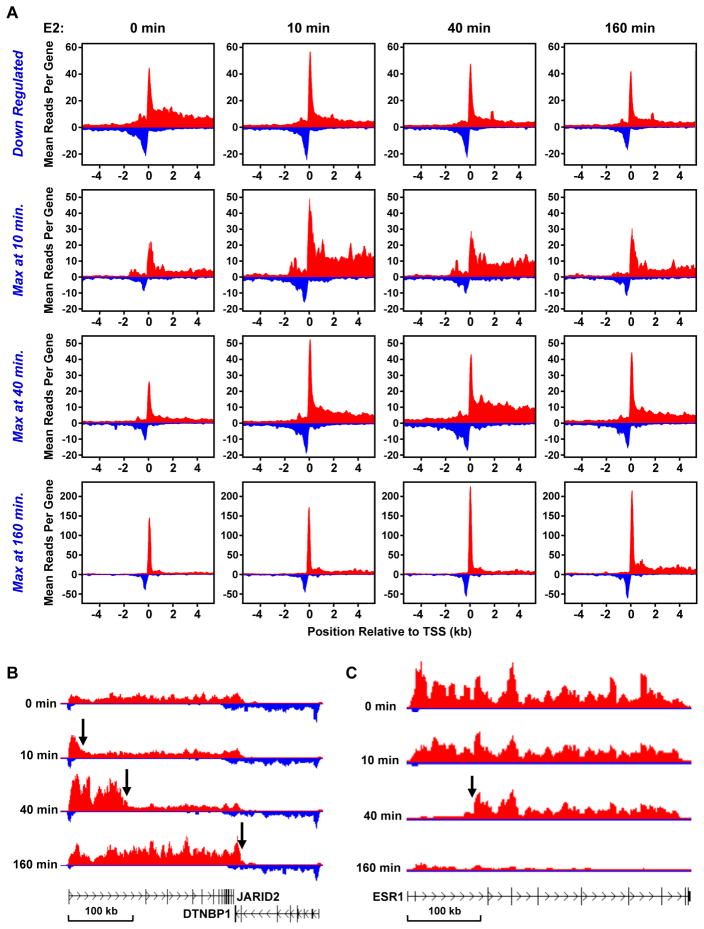
Figure 4. GRO-seq reveals the dynamics of E2-dependent transcription.
(A) Metagene representations showing the average profile of GRO-seq sequence reads near and at the TSSs of RefSeq genes in each of the four classes during the E2 treatment time course.
(B and C) Gene-specific views of the leading (B) and lagging (C) edges of a Pol II “wave” shown for the up-regulated gene JARID2 (B) and the down-regulated gene ESR1 (C), respectively, during the E2 treatment time course.
See also Figure S4.

