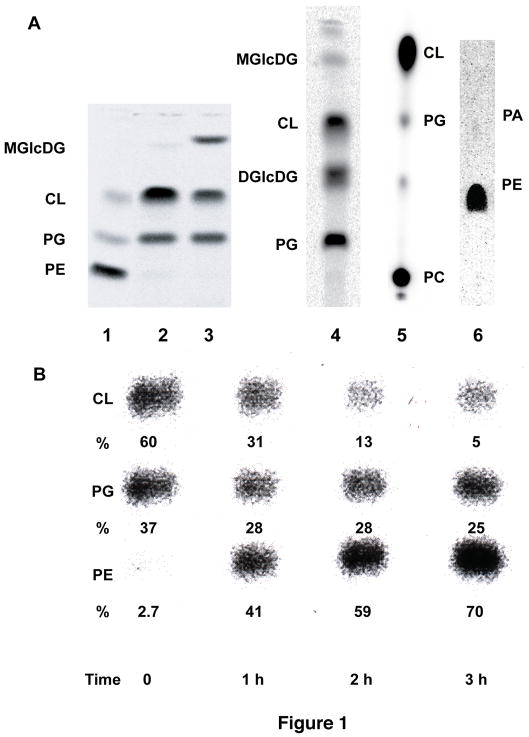
Fig. 1.
Lipid profiles of E. coli mutants with altered lipid compositions. (a) Lane 1. AL95 (pss93::kanR lacY::Tn9)/pDD72 (pssA+ camr) has wild type phospholipid composition (80 mole % PE and 20 mole % PG plus CL) due to complementation by a plasmid (pDD72) copy of the null allele of the pssA gene that encodes the committed step to PE biosynthesis (3). Lane 2. AL95 (pss93::kanR lacY::Tn9) is PE-lacking due to the a null allele of the pssA gene and contains mainly CL and PG (3). Lane 3. Introduction of plasmid pTMG3 (ALmgs ampR) into strain AL95 results in 35 mole % monoglucosyldiacylglycerol (MGlcDAG) due to the expression of the A. laidlawii MGlcDAG synthase gene. The remaining lipids are primarily PG (35 mole %) and CL (25 mole%) (8). Lane 4. Introduction into AL95 of the genes from A. laidlawii that synthesize MGlcDAG and diglucosyldiacylglycerol (DGlcDAG) results in about 30–40 mole % DGlcDAG with less than 1 mole % MGlcDAG (18). Lane 5. Introduction of the pcs gene (placed under OParaB regulatory control) from Legionella pneumophila (30) that confers the ability to synthesize PC results in about 70 mole % PC with the remainder being PG (2.5 mole %) plus CL (26 mole %) and other minor lipids (P. N. Heacock and W. Dowhan, unpublished). Lane 6. UE54 (pgsA::FRT-kan-FRT lpp-2 Δara714 rcsF::mini-Tn10cam) carries a null allele of the pgsA gene encoding the committed step to PG and CL biosynthesis making it devoid of PG and CL and containing about 90 mole % PE, 4.0 mole % phosphatidic acid (PA) and 3.2% CDP-diacylglycerol. Figure and compositional results taken from (31). (b) Phospholipid composition as a function of pssA gene induction. Strain AT2033 was grown first in the absence of aTc (time 0) followed by growth in the presence of aTc for 3 h. When grown without aTc, AT2033 has a greatly reduced level of PE and contains elevated levels of PG and CL. Growth in the presence of aTc results a progressive increase in PE to normal levels (5). Lipid composition is shown as mole % of the total major phospholipid species.

