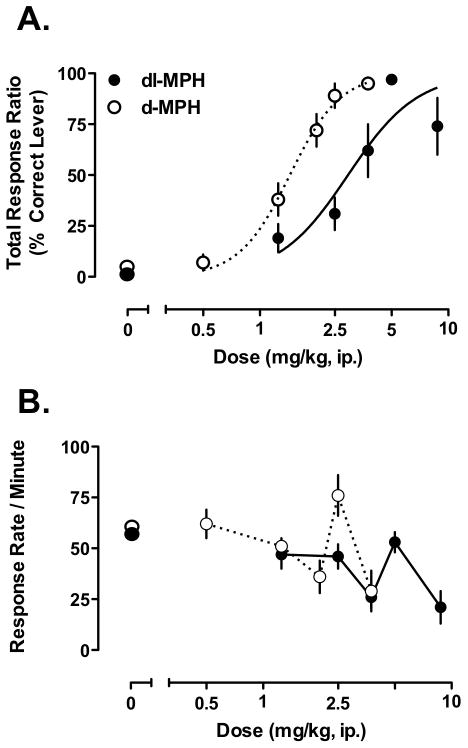
Figure 1.
Discrimination testing in mice trained to discriminate 5 mg/kg dl-MPH (n = 7) or 2.5 mg/kg d-MPH (n = 6). A) The dose substitution curves of dl-MPH and d-MPH are parallel and the d-MPH curve is shifted to the left, consistent with the use of lower, albeit equimolar, doses compared to the dl-MPH curve. The ED50 values are 3.2 ± 0.3 and 1.5 ± 0.09 mg/kg for the dose response functions of dl-MPH and d-MPH, respectively. B) Response rates for both compounds declined slightly with increasing dose. However, responses were higher when mice were tested on their training dose for both compounds, indicated by arrows (▲) Values are means ± S.E.M.

