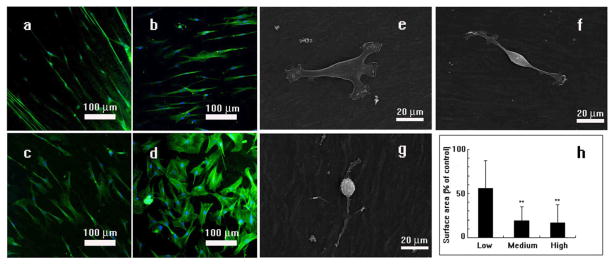
Figure 3. Effect of phage concentrations on the morphology of MSCs.
Typical fluorescent images and SEM images of the phage films derived from phages with different concentrations (a and g, 1014pfu/ml; b and f, 1013pfu/ml; c and e, 1012pfu/ml; d, slides coated with polylysine) show that the phage concentration can affect the degree of cell alignment and stretching. MSCs were arranged at a higher degree of order and extension on phage films derived from phage with the higher concentration (1014 pfu/ml, a) in comparison with those seeded on the film generated from phage with a lower concentration (1012 pfu/ml). In all images, cell nuclei are stained by DAPI (blue) and the F-actin of cells are stained by FITC-labeled phalloidin (green). The cells surface area depends on the phage concentration (* p<0.05, ** p<0.01) as shown in (h). At a higher phage concentration (g), MSCs are highly stretched, resulting in a lower surface area. At lower phage concentration (e), MSCs are spread out, resulting in a higher surface area.

