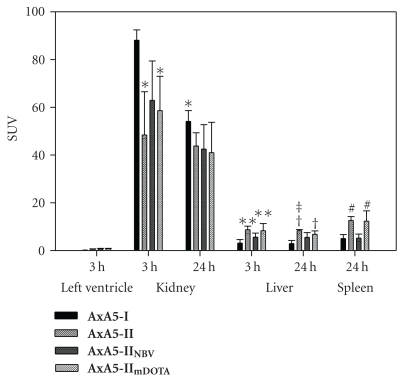
Figure 3.
SUVs as determined by drawing regions of interest around target tissue and expressed as Mean ± SD (n = 3) of target organs at end of 3 h dynamic scan and/or 24 hr after injection of 64Cu-labeled Annexin A5 adducts. *P < .05 versus 3 h AxA5-I Kidney, **P < .05 versus 3 h AxA5-I Liver, † P < .01 versus 24 h AxA5-I Liver, ‡ P < .05 versus 24 h AxA5-IINBV Liver, # P < .01 versus 24 h AxA5-I and AxA5-IINBV Spleen.

