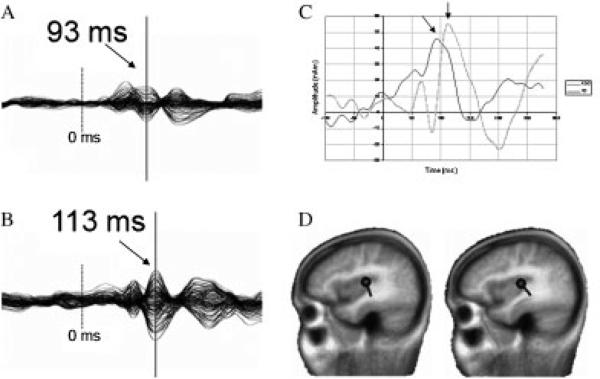
Figure 1.
(A) Right-hemisphere M100 STG sensor waveforms for a typically developing and (B) age-matched ASD participant. Note similar sensor waveform morphology, but temporal shift (~20 msec) in participant with ASD. Dashed vertical line indicates stimulus onset (0 msec). Arrows indicate M100 peak. (C) Right-hemisphere source waveforms derived from BESA standard source model applied to the sensor data shown in (A) and (B). Note the similarity in M100 peak latency between the sensor and source waveforms. (D) Sagittal brain image displays STG dipole differentially oriented at peak M100 amplitude for both subjects.

