Figure 2.
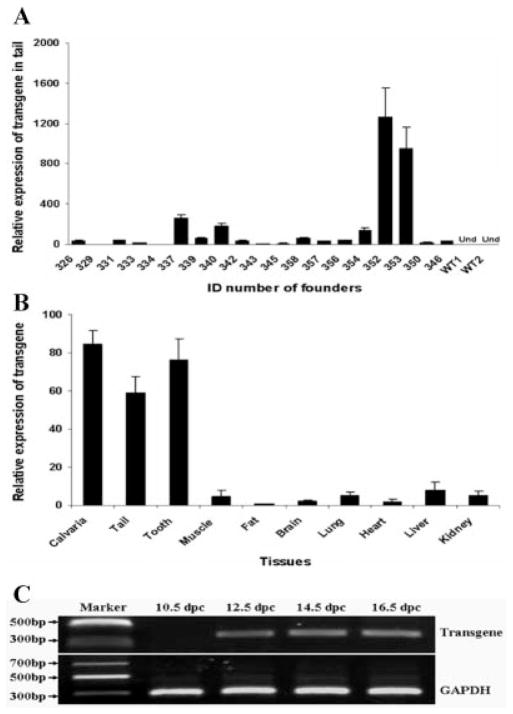
Expression of transgene in transgenic mice. A: Analysis of transgene expression levels in tail tissues of transgenic founders by relative quantitative real-time PCR at 5 weeks of age. WT, wild-type; Und, undetectable. Real-time PCR was performed three times. Data are presented as mean ± SEM. Expression levels of transgene in all the transgenic founders were normalized to the founder 334, which has the lowest expression of the transgene. B: Analysis of transgene expression levels in different tissues of transgenic mice by relative quantitative real-time PCR at the age of 5 weeks. Real-time PCR was performed on three transgenic littermates of line 353. Data are presented as mean ± SEM. Expression levels of transgene in all tested tissues were normalized to fat tissue, which has the lowest expression of transgene. C: Detections of transgene expression in tail tissue at different embryonic stages by reverse transcription PCR. dpc, days postcoitum.

