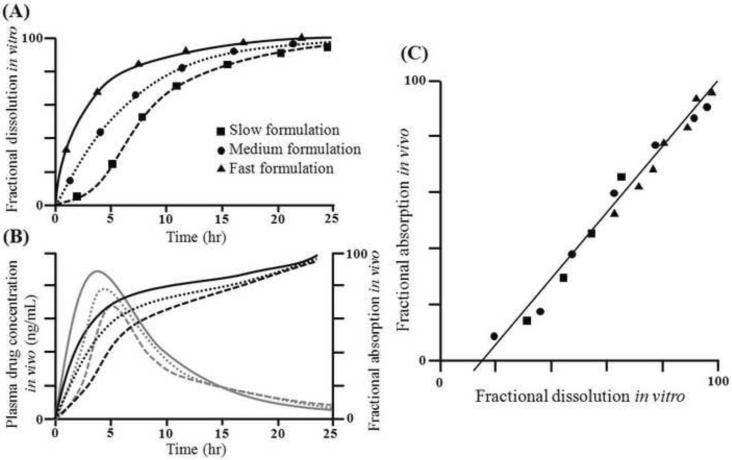
Figure 1.
Example of Level A IVIVC. (A) In vitro dissolution profiles of slow (square), medium (circle), or fast drug formulations (triangle). (B) In vivo studies provide plasma drug concentration of each formulation (gray lines), which can be converted to factional absorption profile (black lines) by deconvolution. (C) Level A IVIVC can be derived from the fractional dissolution in vitro and the fractional absorption in vivo. Figure shows a linear correlation, but FDA accepts non-linear correlation as well.

