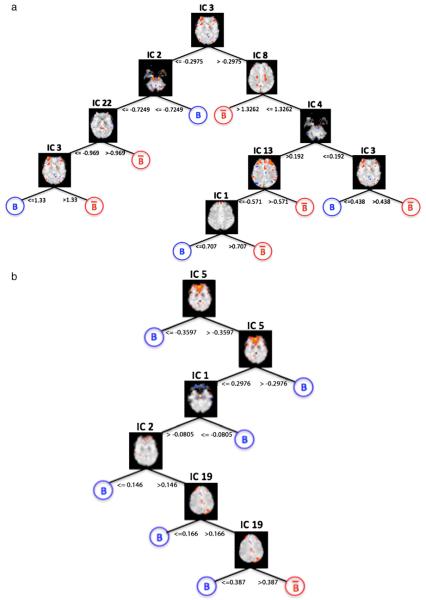
Fig. 8.
Structure of J48 decision tree nodal hierarchy for two subjects. IC spatial maps indicate decision nodes. Blue and red circles indicate terminal leaves with discrete outcome labels for belief and disbelief, respectively. Certain IC basis images used for recursive splits have overlap with general linear model contrasts for belief-disbelief and disbelief-belief. For example, in (b), IC 5, used for the initial data split, contains overlap with belief-disbelief contrasts. (For interpretation of the references to colour in this figure legend, the reader is referred to the web version of this article.)

