Figure 3.
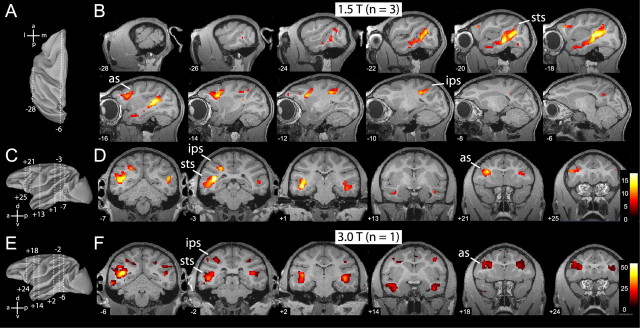
Overview of MR brain activations during the observation of grasping actions. A, Top view of reconstructed (Caret) left hemisphere to illustrate locations of most lateral (x = −28 mm) and medial (x = −6 mm) sagittal slices shown in B. B, SPMs for the contrast: hand action versus static control (p < 0.05, corrected), masked inclusively with the contrast hand action versus scrambled control, and with the contrast all stimuli versus fixation baseline (p < 0.001, uncorrected), overlaid on sagittal MR anatomical images of left hemisphere of M12. Group data of three monkeys (M3, M5, and M6; 1.5 T). Numbers on each slice indicate x-coordinate (lateral to medial). C, E, Lateral view of reconstructed left hemisphere indicating the six different anteroposterior levels at which coronal slices are shown in D and F, respectively. D, SPMs for the same contrast as in B, but overlaid onto coronal anatomical sections of M12. Numbers on each slice indicate y-coordinate (anteroposterior from interaural plane). Shown are group data of three monkeys (M3, M5, M6). F, Statistical parametric maps for the same contrast (but acting person) shown in B and D, from a single subject (M15, 3T), overlaid on coronal sections of same anatomical template (M12). Numbers on each slice indicate y-coordinate. Abbreviations are as in Figure 2.

