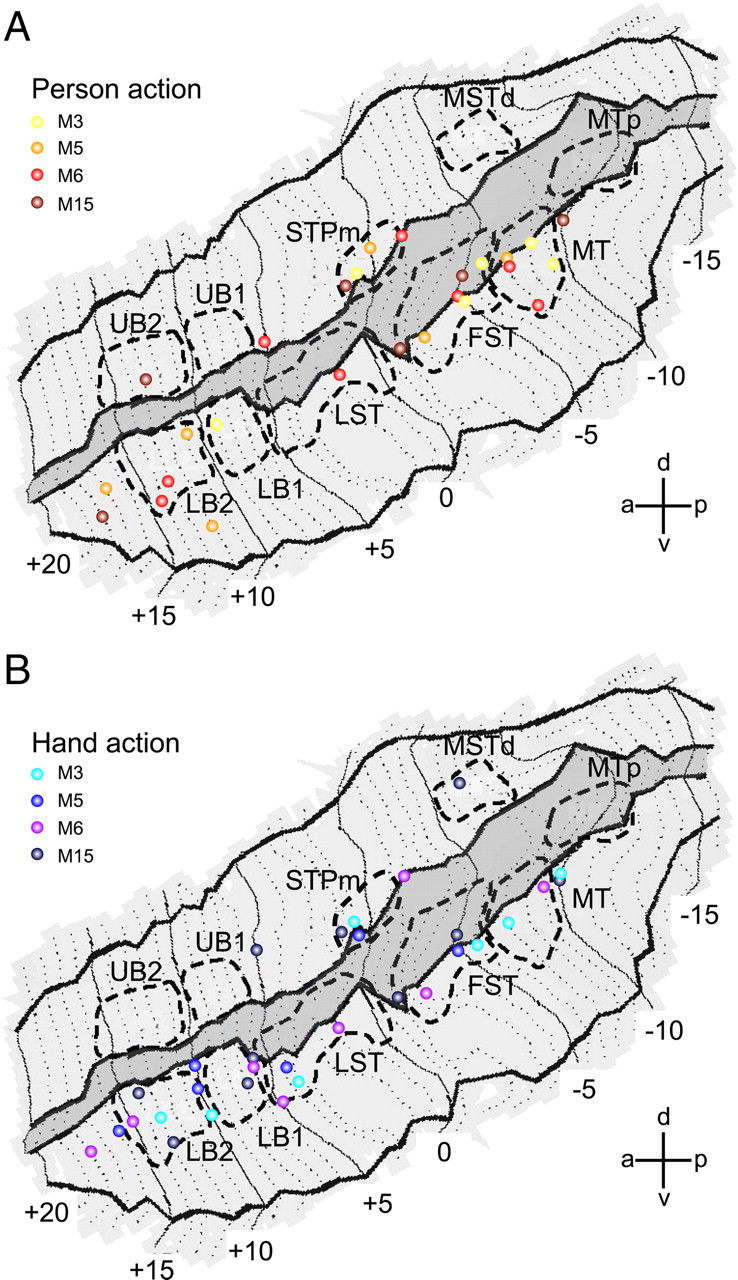
Figure 5.

Individual fMRI local maxima for observation of person grasping and hand grasping in STS. A, Local maxima from all acting person observation tests (4 single subjects), overlaid onto the flattened representation of left STS. SPM local maxima are plotted from the contrast acting person versus the average of all three controls (scrambled, static middle, and static end; p < 0.001, uncorrected). B, Local maxima from all isolated hand action observation tests (same 4 single subjects), overlaid onto the flattened representation of left STS. Data from 10 different daily sessions were used (2 sessions each from M3, M5, and M6, and 4 sessions from M15). Location of the 10 STS ROIs are indicated with dashed lines. The darker gray area indicates fundus of the STS.
