
Figure 9.
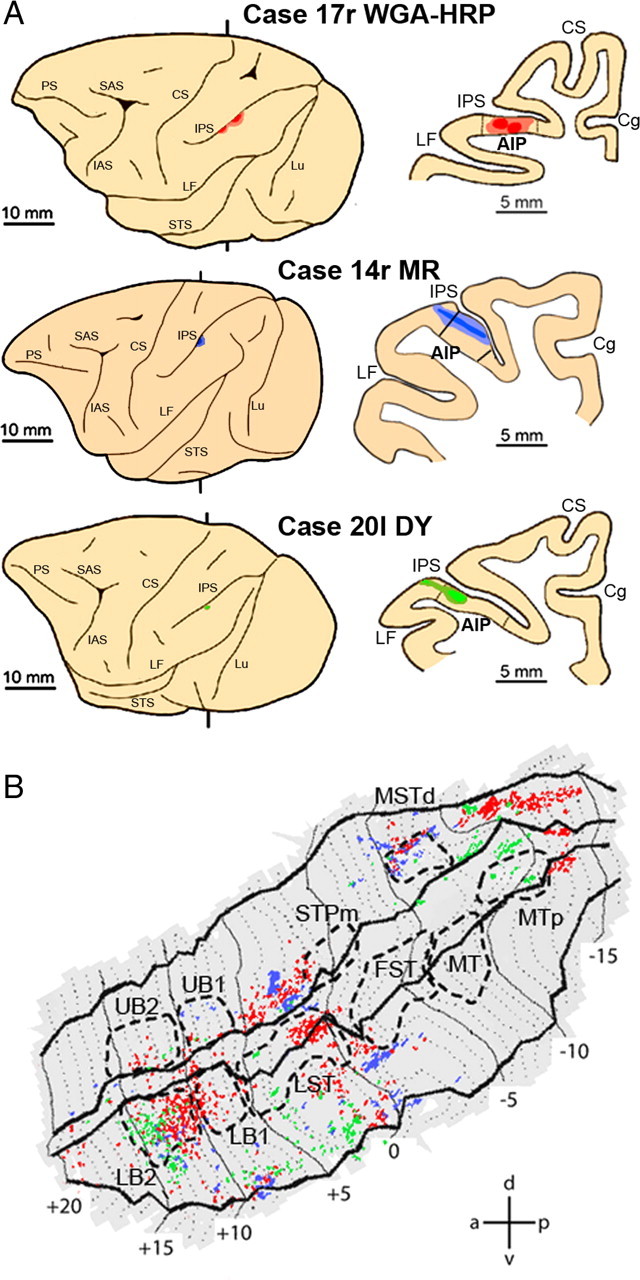
Distribution of STS labeling after tracer injections into area AIP. A, Location of the AIP injection sites shown on the lateral view of the hemisphere (left side) and in a coronal section (right side) in three representative cases. B, Distribution of retrograde labeling in STS observed in the three cases, overlaid onto a flat map of STS. The color code corresponds to the three cases from A. STS ROIs are indicated with dashed lines. Abbreviations and conventions are as in Figure 7.