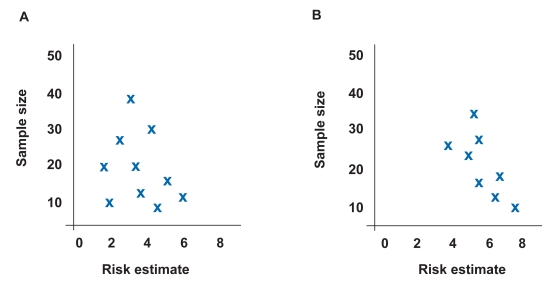
Figure 1.
Example of funnel plot demonstrating no publication bias where the estimated true risk is 4. Risk estimates are evenly distributed around true risk (A). Example of funnel plot demonstrating publication bias where the estimated true risk is 4. Risk estimates cluster in lower right-hand corner, indicating that small studies with positive results are more likely to be published (B).

