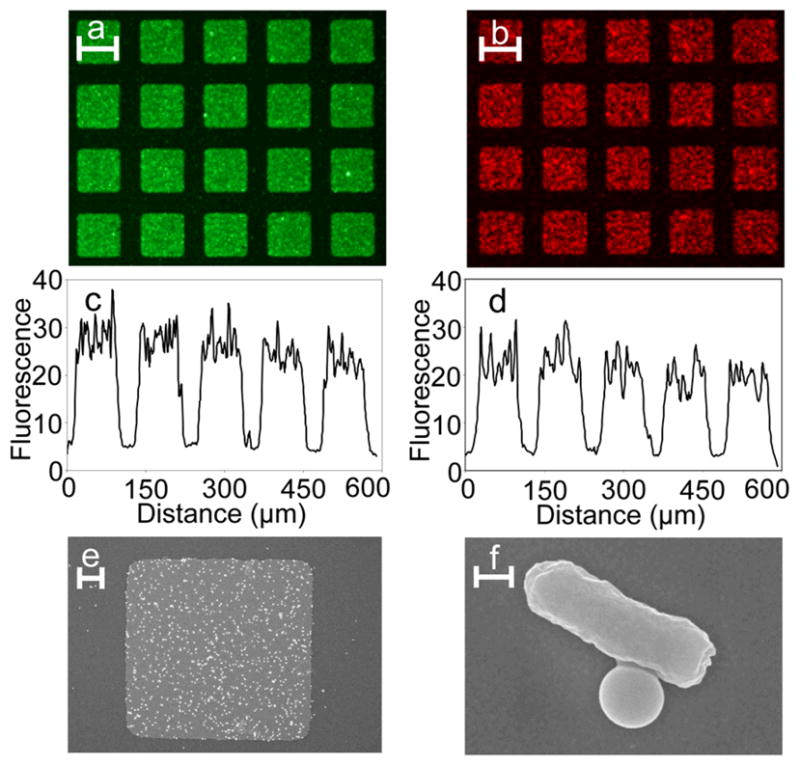
Figure 2.

Verification of the specificity of attachment. (a–b) Fluorescence images and (c–d) line intensity plots of the selective attachment of beads (green; a and c) and E. coli bacteria (red; b and d) to Au patterns on Si substrates. (e) SEM image of a single square Au pattern with attached bacteria-bead conjugates and (f) zoom-in of a single bacteria-bead conjugate. Scale bars in panels a, b are 80 μm, panel e is 10 μm and panel f is 0.5 μm long.
