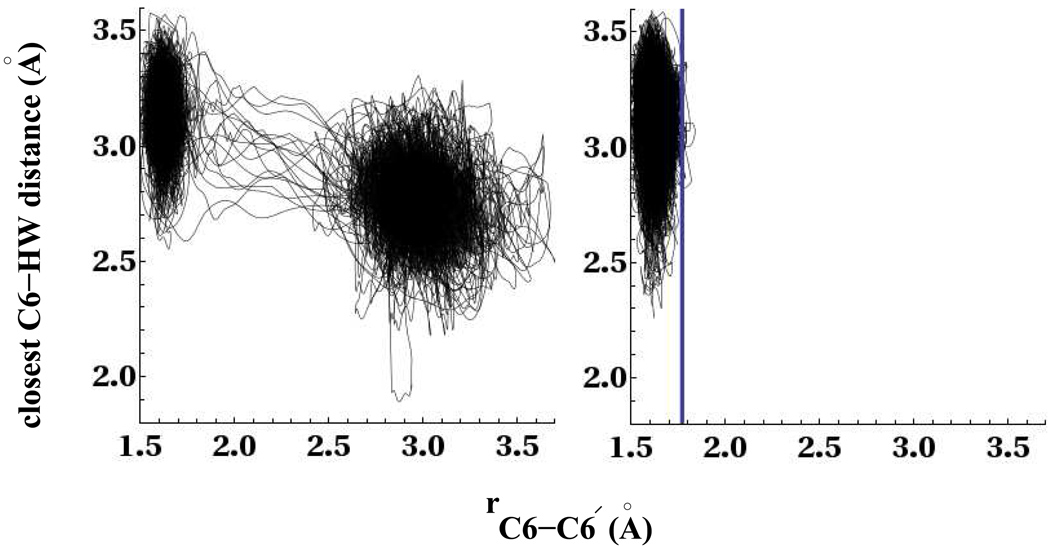
Figure 13.
Left panel shows the evolution of the C6-C6′ distance with the closest water distance to the C6 atom for splitting trajectories. The right panel shows the same for trajectories that do not split within the timescale of our simulation runs. The vertical line in the right-hand plot indicates the transition state for splitting of the C6-C6′ bond.

