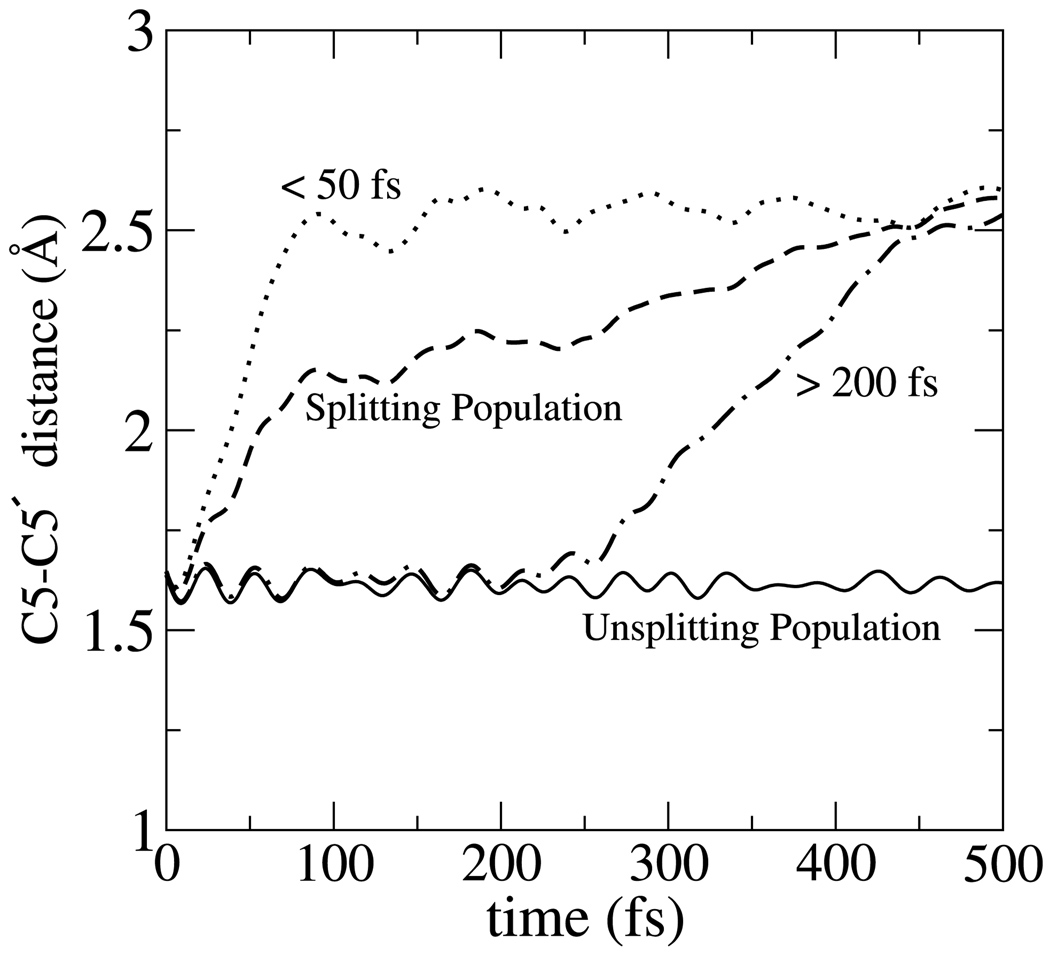
Figure 2.
Non-equilibrium dynamics of C5-C5′ bond after electron injection leading to splitting and unsplitting populations. The solid curve (unsplitting population) is the average C5-C5′ bond length among 48% of trajectories with no C5-C5′ bond cleavage out to 500fs. The dashed curve (splitting population) gives the same average for the remaining 52% of trajectories. Also shown are trajectories from the splitting population that split within 50fs (60%) and between 200–500fs (40%).

