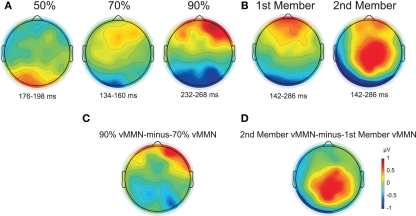
Figure 4.
(A and B) Topographic map of the deviant-minus-standard difference potentials from Experiment 1 and 2 (A and B, respectively). The plotted voltage values resulted from averaging data points within the indicated intervals selected by the point-by-point t-tests at Oz site. (C) Difference potential map of the 90–70% vMMN waveforms (measured in the 232–268 and 134–160 ms intervals, respectively). (D) Difference potential map of the 2nd member vMMN minus 1st member vMMN waveforms (both measured in the 142–286 ms interval).

