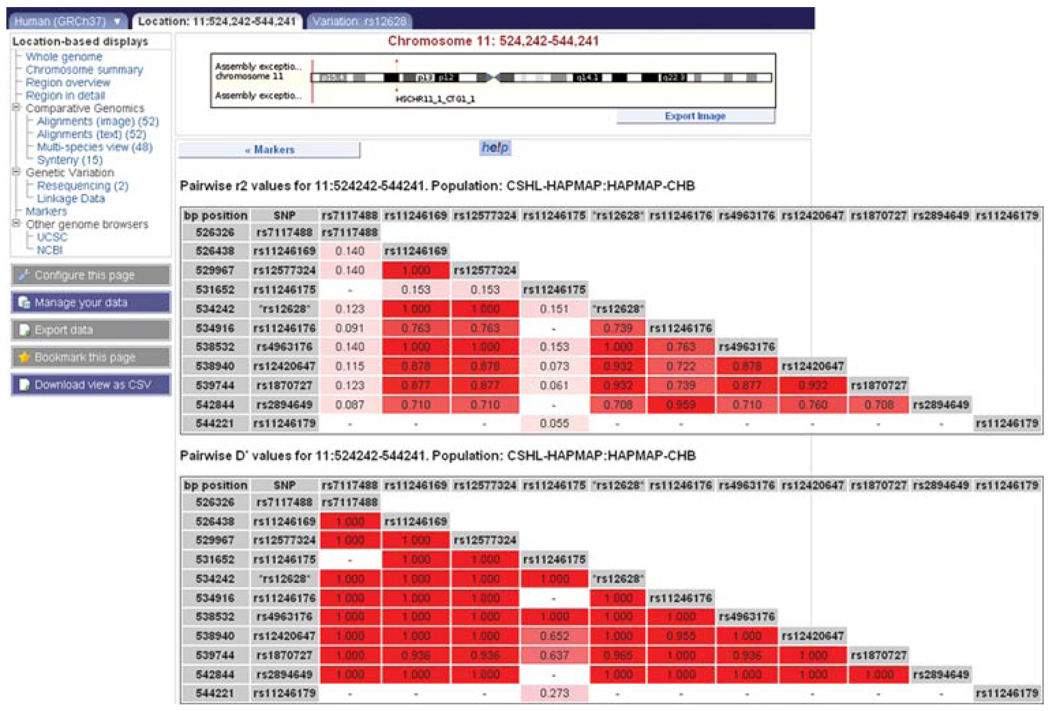
Figure 6.11.17.
The location tab: Linkage Data view. This view is reachable from the variation tab: summary view, if linkage disequilibrium (LD) values have been calculated for the specific variant. Clicking on the LD plot for the population “CSHL-HAPMAP:CHB” in the variation summary view for rs12628 will open the “Linkage Data” view. Click “Export data” at the left of the view to export the table of LD values shown in this figure.

