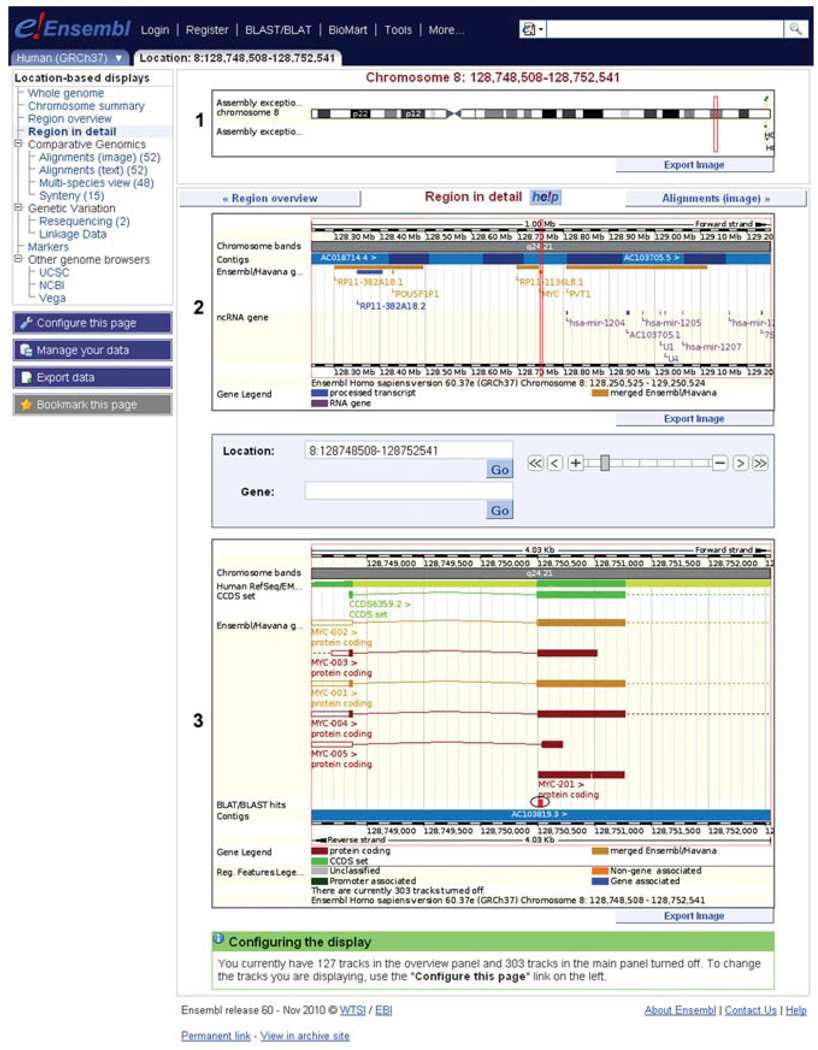
Figure 6.11.7.
Location tab: “region in detail” view, centered on the human MYC gene. (1) The chromosome panel reveals banding from homochromatin/heterochromatin staining. The red box shows the position of the MYC gene. (2) The “top panel” is centered on the MYC gene, indicated by the red box. Contigs are colored in light and dark blue, to differentiate them in the assembly. Clicking on a contig will show its identifier. Neighboring genes to MYC are indicated along the genomic assembly. Click on any gene to recenter the display. (3) The “main panel” is zoomed in to the MYC gene, further explored in Figure 6.11.8. The BLAT hit is circled. All panels can be exported as images using a button at the lower right-hand corner of each panel. For color version of this figure go to http://www.currentprotocols.com/protocol/hg0611.

