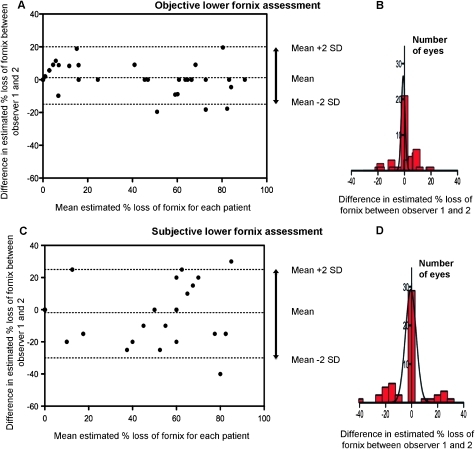
Figure 3.
Bland–Altman plots showing interobserver variation in lower fornix assessment ((A) objective and (C) subjective). Some data points are identical and therefore overlay each other on the figures. The percentage difference in assessment between observer 1 and 2 is plotted against the mean percentage loss of fornix for each eye. If there was a completely normal fornix, this is represented as 0% loss of fornix on the x axis. Note the increase in the 95% limits of agreement (±2SD) for subjective assessment (arrowed), demonstrated also by the histograms (B,D).

