
Figure 4.
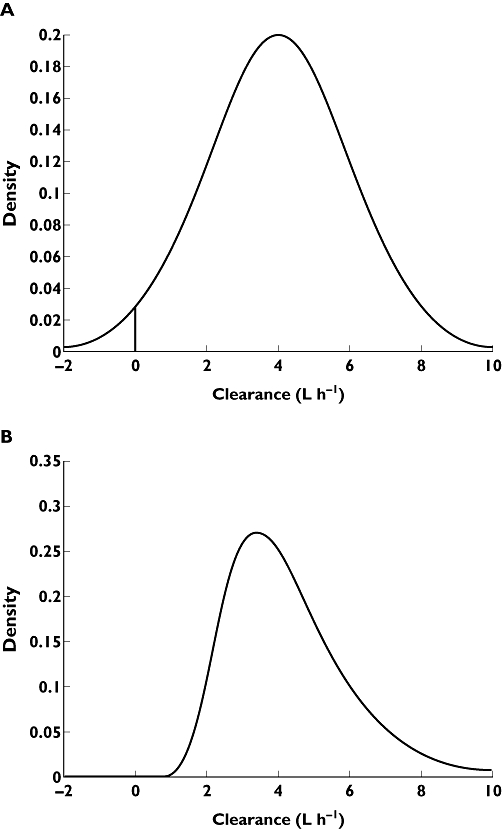
The distribution of values of CL in the population. (A) Allows the distribution to be normal. The verticle line at 0 indicates the lower bound of biologically acceptable values. Here 2.3% of the predicted values of CL are unrealistic. (B) Allows the distribution to be lognormal. Negative (or zero) values of predicted CL are not allowed