
Figure 3.
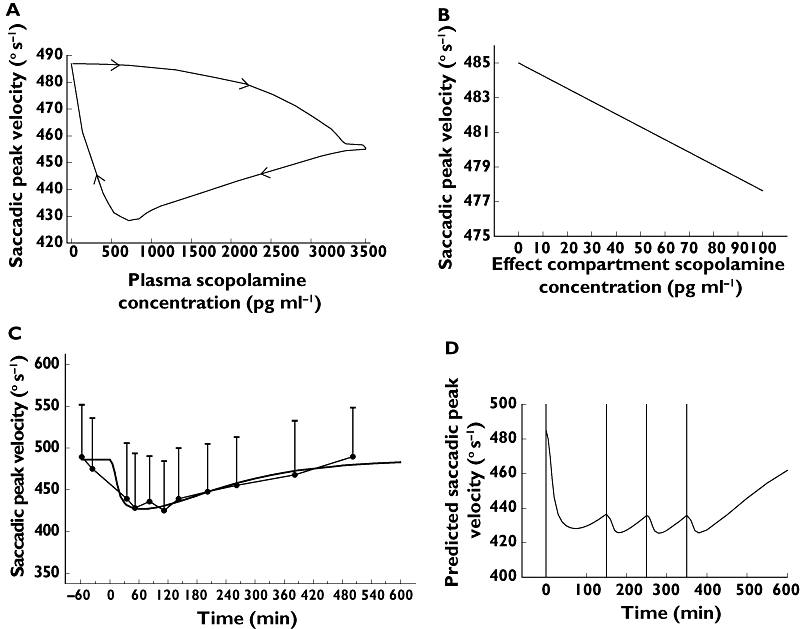
Saccadic peak velocity: (A) clockwise hysteresis loop formed by the plasma concentration–effect curve; (B) effect compartment concentration–effect curve; (C) predicted (dark line) and observed (closed circles) time–effect curve with 95% CI error bars; (D) mean predicted dosing regimen (0.45-mg i.v. infusion 15 min at t = 0 and 0.15-mg i.v. infusion over 15 min at t = 150, t = 250 and t = 350 min) to attain a saccadic peak velocity reduction of 50° s−1