
Figure 4.
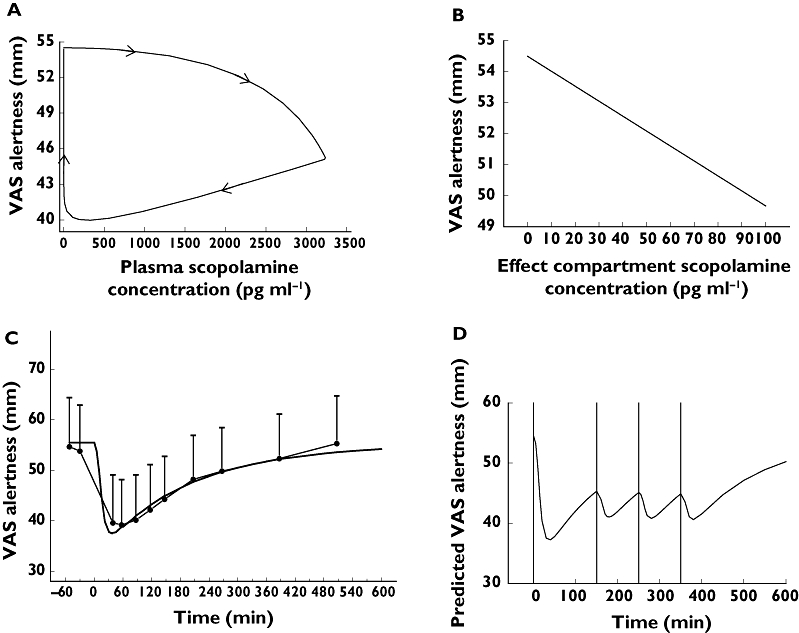
For visual analogue scale (VAS) alertness (A) clockwise hysteresis loop formed by the plasma concentration–effect curve; (B) effect compartment concentration–effect curve; (C) predicted (dark line) and observed (closed circles) time–effect curve with 95% CI error bars; (D) mean predicted dose regimen (0.45-mg i.v. infusion over 15 min at t = 0 and 0.15-mg i.v. infusion over 15 min at t = 150, t = 250 and t = 350 min) to attain a VAS alertness reduction of 10 mm