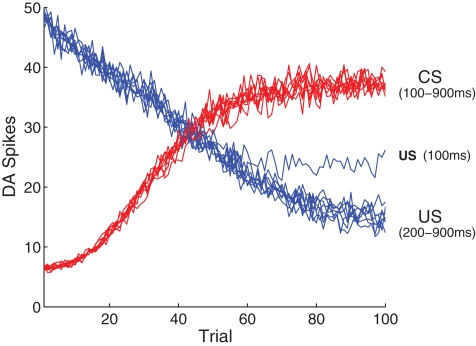
Figure 7.
Model performance with respect to multiple ISIs. Here, the number of DA spikes in the 50 ms following stimulation are averaged over 50 simulation runs, for each ISI. Results from nine different ISIs (100–900 in 100 ms steps) are superimposed, demonstrating that development of a CS response and suppression of a US response is independent of any specific ISI. An exception is the extremely short ISI of 100 ms, where suppression of the US begins to break down because of overlap with the CS representation.

