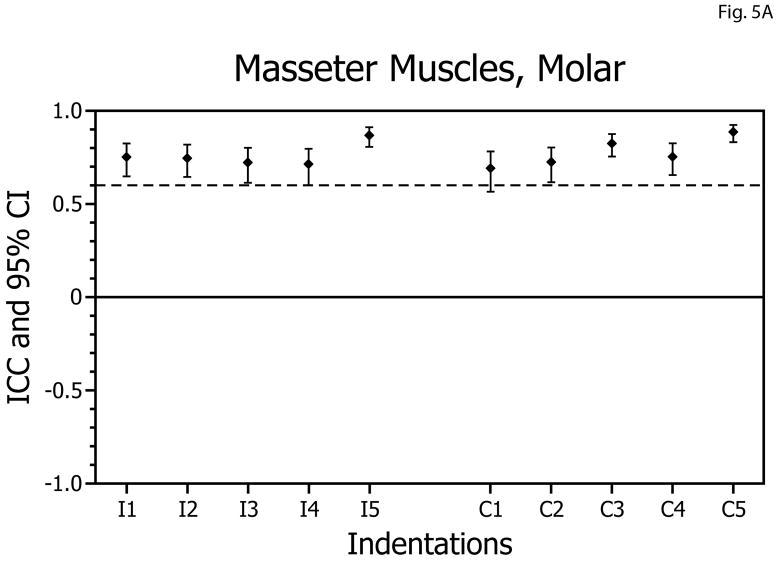
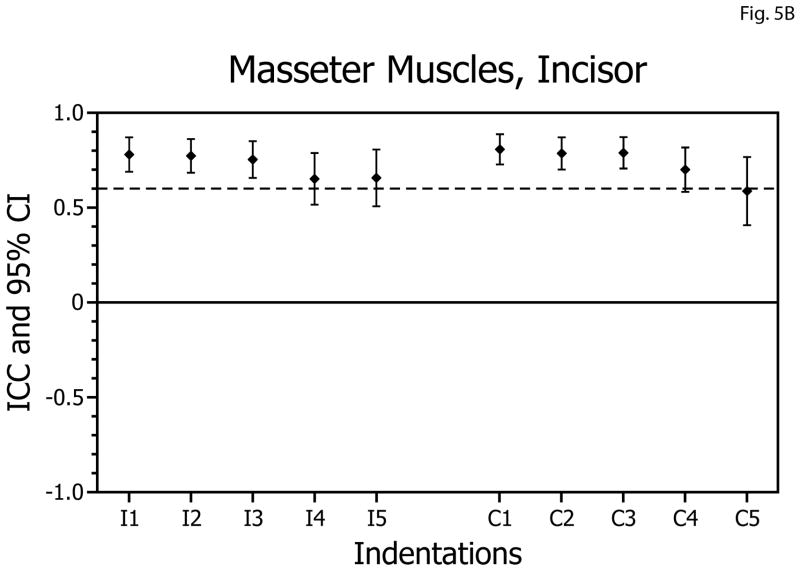
Figure 5.
Intra-class correlation coefficients (ICCs) and confidence intervals (vertical bars) for test-retest of masseter muscle activity versus bite-force slopes during molar biting (A) and incisor biting (B). ICCs are plotted on the vertical axis; ipsilateral (I; left-side) and contralateral (C; right-side) muscle data are plotted on the horizontal axis with results for indentations 1 to 5 presented in left-to-right sequence.


