Figure 1.
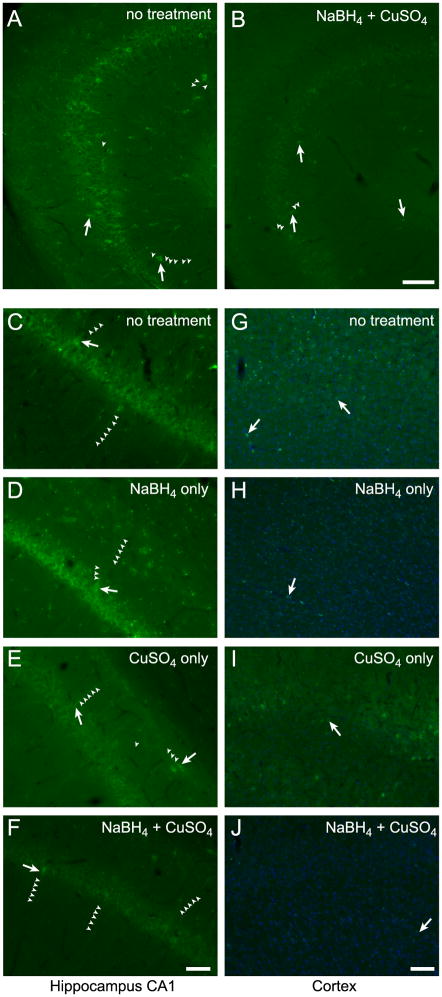
Green autofluorescent cells are evident in hippocampus and cortex of rat brain sections after treatments to reduce endogenous fluorescence. Area CA3 of hippocampus in a brain section that was only washed and mounted (A). Same view of a serial section treated with NaBH4 and CuSO4 (B). CA1 of hippocampus (C–F) and cortex (G–J) in serial brain sections. Sections were either washed and mounted (C&G), treated with NaBH4 only (D&H), treated with CuSO4 only (E&I) or treated with both NaBH4 and CuSO4 (F&J). Arrows indicate examples of prominent autofluorescent cells and small arrowheads delineate autofluorescent cellular processes. A&B, C–F and G–J were identically acquired and adjusted for brightness for accurate comparison. Blue in G–J is TO-PRO-3 iodide staining of nuclei. Scale bars: A&B 100 μm, C–F 50 μm, G–J 100 μm.

