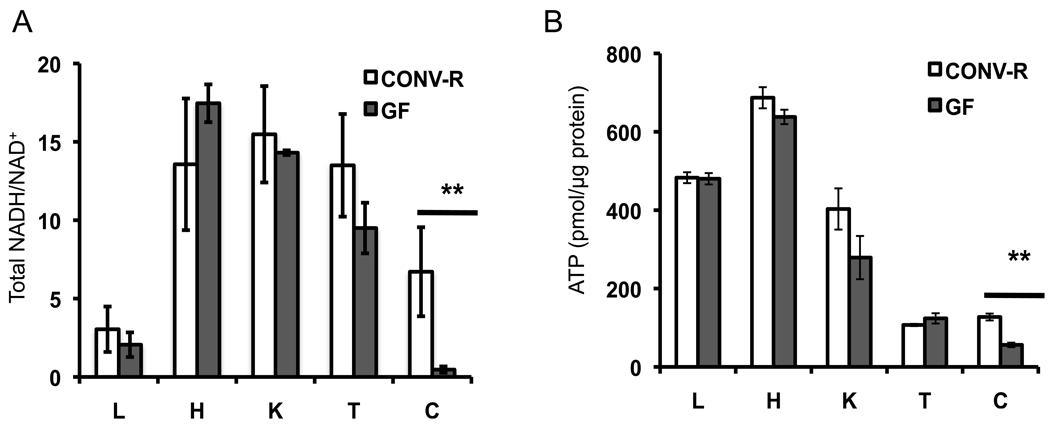
Figure 1. Effects of Microbiota on Energy Homeostasis.
Total NADH/NAD+ ratios (A) and ATP levels (B) in various tissues from GF and CONV-R mice. L, liver; H, heart; K, kidney; T, testis; C, colon. 6 GF and 6 CONV-R mice were analyzed, and results are mean ± SEM. Significant differences are indicated (**p <0.01).

