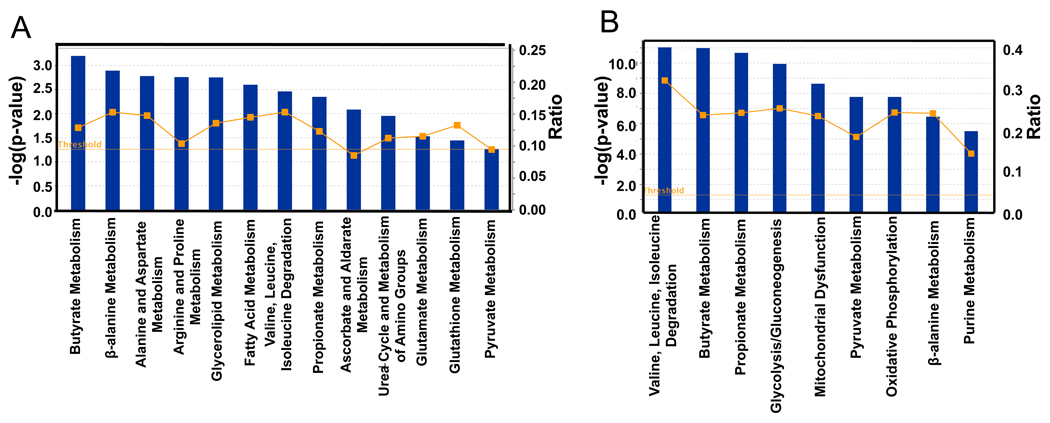
Figure 2. Analysis of Microbiome Regulated Gene Products and Metabolites.
Top KEGG pathways of transcriptome (A) and proteome (B) identified as differences between GF and CONV-R. Blue bars correspond to −log (p-values) shown on y-axis at left. Straight yellow lines represent threshold of significance for these −log (p-values). Yellow boxes represent the ratio, shown on y-axis at right, and indicate the number of genes or proteins affected divided by total number within category. 6 GF and 6 CONV-R mice were used for the transcriptome analysis. For the proteome analysis, 3 GF and 3 CONV-R mice were used.

