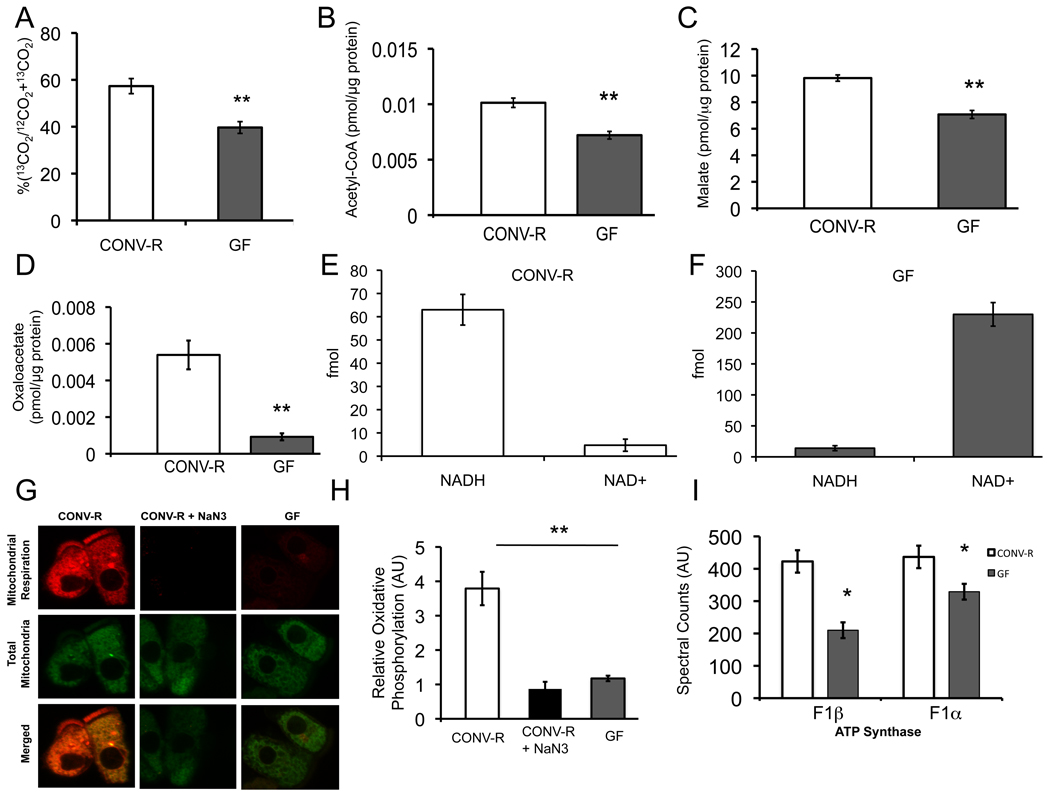
Figure 3. Regulation of Colonocyte Oxidative Metabolism.
(A) Percentage of 13C-butyrate metabolized to 13CO2 in CONV-R and GF colonocytes. (B–D) Measurement of intermediary metabolites. Levels of acetyl-CoA (B), malate (C), and oxaloacetate (D) in CONV-R and GF. (E, F) Levels of mitochondrial NADH and NAD+ in CONV-R (E) and GF (F) colonocytes. The different scales reflect different amounts of material loaded and detected by HPLC-LC-MS. (G) Oxidative metabolism indicated by MitoTracker Red CM-H2XRos (red fluorescence; top panel) and MitoTracker Green FM (green fluorescence; middle panel) in colonocytes from CONV-R, CONV-R with NaN3 (sodium azide, negative control), or GF. (H) Quantification of oxidative metabolism in different experimental groups. (I) Spectral counts from quantitative mass spectrometry of ATP synthase F1α and β. Results in A–D, G, and H are displayed as mean ± SE and significant differences are identified (*p <0.05, **p <0.01). For panels A–D, 4 GF and 4 CONV-R mice were used. In panels E–H, 3 mice were used per condition.

