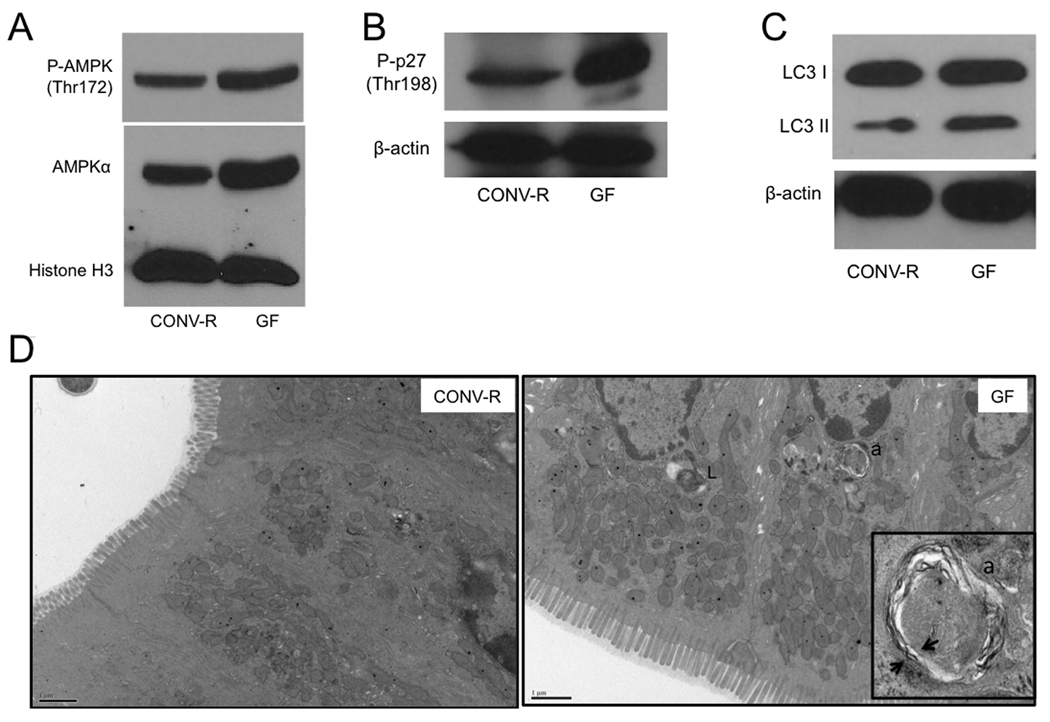
Figure 4. Microbial Regulation of Energy Metabolism and Autophagy.

(A–C) Western blot analysis of phosho-AMPK and AMPK (A), phospho-p27 (B) and LC3-I and -II (C) with histone H3 or β-actin as loading controls in CONV-R and GF. (D) Transmission electron micrographs of CONV-R and GF colonic epithelium. Lysosomes (L) and autophagosomes (a) are indicated, and arrows show double membrane of autophagasome in inset. For A–C, western blots are representative of 4 experiments using 2 CONV-R and 2 GF mice with 2 technical replicates each.
