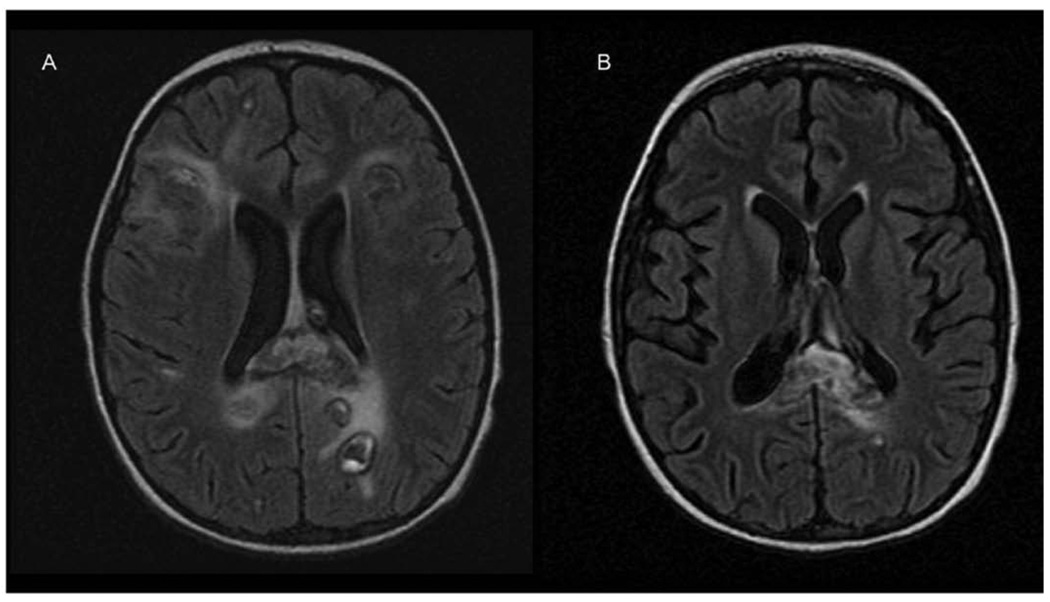
Figure 2.
(A) Magnetic resonance imaging (MRI) brain demonstrating multiple areas of mixed signal likely representing hemorrhage surrounded by increased T2 signal compatible with edema or ischemic changes. (B) MRI brain (fluid-attenuated inversion recovery [FLAIR] T2) demonstrating reduction in the volume of hemorrhages and diffuse cerebral volume loss manifested as dilation of the ventricular system.

