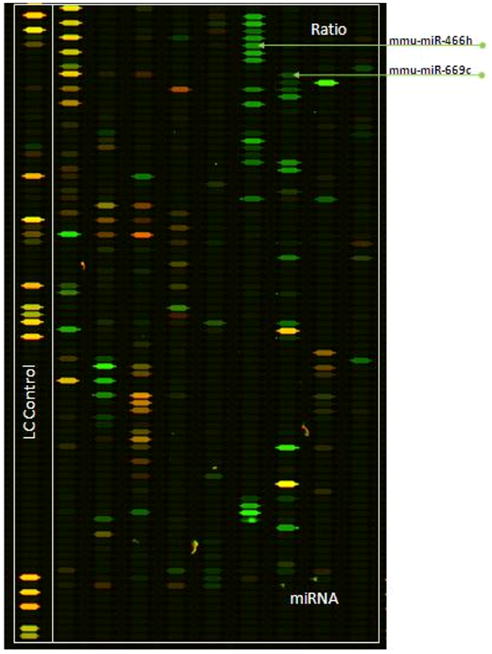
Figure 3.

Map of the overlaid images of the respective microRNA fluorescent signals in nutrient-depleted and fresh media grown CHO-S cells. Each well represents a distinct microRNA. Depleted media derived RNA sample was labeled with Cy3 (green) and fresh media with Cy5 (red). The wells with probes for mmu-miR-466h and mmu-miR-669c are pointed at with arrows.
