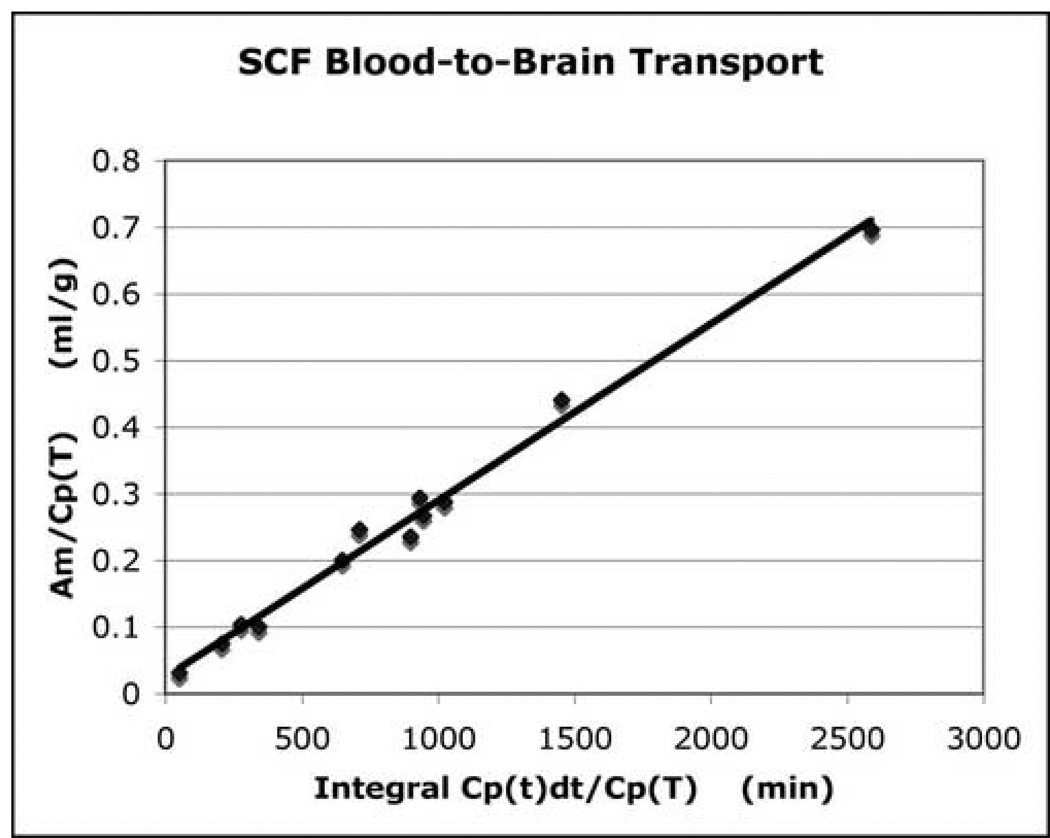
Fig. 1.
Transportation of SCF from the blood to the brain. The linear slope of the line presents the influx constant (K1). Y-axe presents tissue plasma space (ml/g). X-axe shows a measure of the plasma arterial integral over time (min). The data indicates that SCF is slowly and continuously transported from the blood to the brain.

