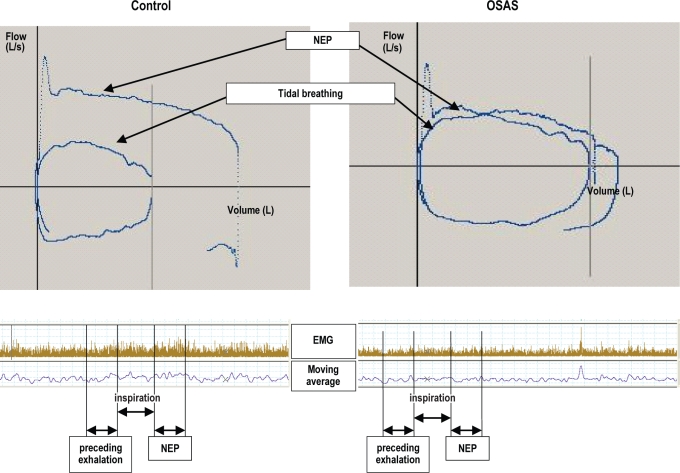
Figure 2.
The flow-volume curves and EMG signals from a control subject (left panel) and subject with OSAS (right panel) during NEP compared to tidal breathing. In the control subject, the flow-volume curve during NEP is larger than during the preceding tidal exhalation. In the OSAS subject, the difference between the two curves is much smaller. There were no differences in the EMG before and after NEP. NEP, negative expiratory pressure; OSAS, obstructive sleep apnea syndrome.

