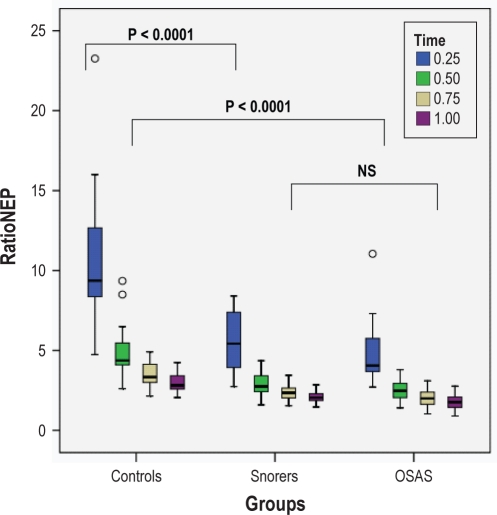
Figure 3.
Box plots of RatioNEP at different time points and at a pressure of −5 cm H2O in the seated position are shown for the 3 groups. The box represents the interquartile range which contains 50% of values. The line across the box indicates the median. The whiskers extend from the box to the highest and lowest values, excluding outliers. Outliers (o) are defined as cases with values between 1.5 and 3 box lengths from either end of the box. For ease of presentation, 2 extreme outliers were omitted; these were controls at the 0.25 time point with values of 41.54 and 27.14.

