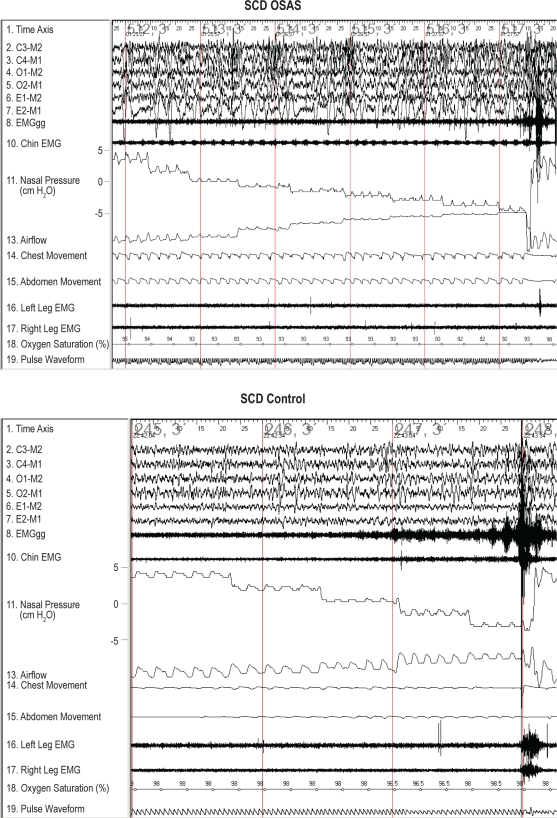
Figure 1.
Typical examples of airflow and EMGgg changes during pressure-flow runs in slow wave sleep are shown for a subject with SCD and OSAS and an SCD control subject. During inspiration, airflow and nasal pressure signal tracings have a negative deflection. Initially, nasal pressure was maintained at the holding pressure. The nasal pressure was then lowered in 2 cm H2O steplike decrements every 5 breaths until arousal or obstructive apnea occurred. The baseline of the airflow tracings for both subjects moved upwards during the pressure drops due to the change in bias flow. The subject with SCD OSAS had a decrease in airflow with no significant EMGgg increase in response to negative pressure, whereas the SCD control maintained airflow and had a gradually increased EMGgg.

