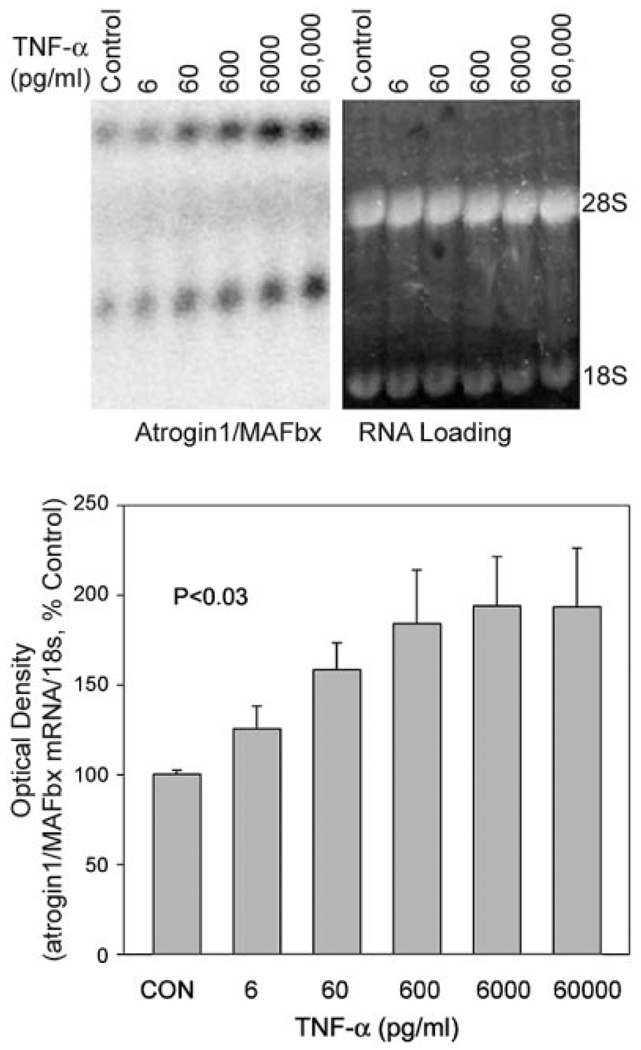
Figure 6.
TNF-α effects on atrogin1/MAFbx mRNA levels are dose dependent. C2C12 myotubes were exposed to TNF-α at the indicated concentrations for 2 h and total RNA was extracted for Northern blot analysis. Upper panel is a representative blot showing multiple atrogin1/MAFbx transcripts (left) and ethidium bromide-stained loading controls (right). Lower panel depicts averaged densitometry data from 3 separate experiments showing the dose dependence of atrogin1/MAFbx up-regulation; P < 0.03 by ANOVA.

