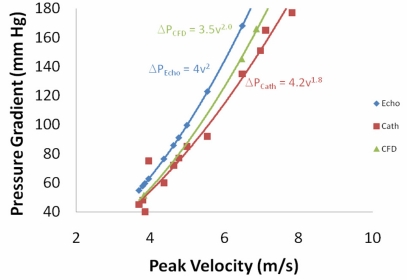
Fig. (9).
Peak pressure gradient between the outflow tract and aorta as a function of the peak velocity for the 0.52cm 2 orifice using 3 different methods -- Echocardiography with the simplified Bernoulli equation, the CFD model with the RNG k-ε turbulence model, and catheters in the in vitro left heart model.

