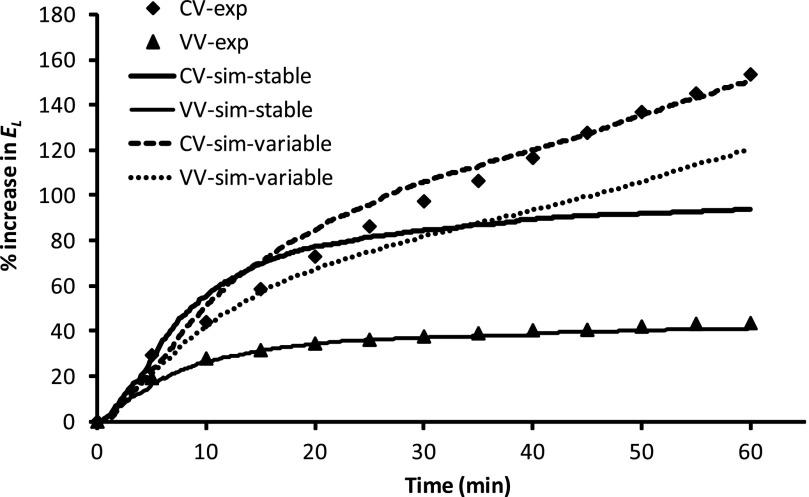
Fig. 1.
Comparison of simulated (sim) and experimentally measured (exp) mean time course of percent changes in total lung elastance (El) over 60 min of conventional ventilation (CV) or variable ventilation (VV) at 3 cmH2O positive end-expiratory pressure (PEEP). Simulated curves are averages of 400 independent simulations drawn from distributions for closing and opening pressures and speeds, and the same set of model parameters were used for CV and VV under stable (mean airway critical pressure and speeds remain constant during ventilation) or variable (mean airway critical pressure increases linearly with time during ventilation) condition. Experimental curves are averages of 8 mice for CV and VV.

