Figure 2.
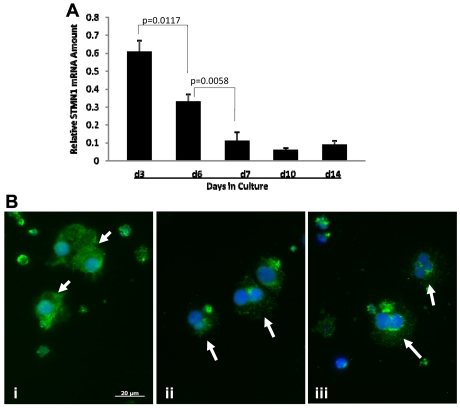
Stathmin expression in human primary MKs. (A) mRNA extracted from MKs generated in liquid culture from CD34+ cells was reverse-transcribed and then amplified by quantitative real-time PCR using human stathmin and GAPDH primers. Relative mRNA amounts obtained at different time points during culture (ie, day 3 [d3] to day 14 [d14]) were plotted after normalization to GAPDH. The results represent the mean ± SD of duplicates in 3 independent experiments. Only statistically significant differences are indicated by the P values. (B) MKs generated in the presence of thrombopoietin for 7 days were immunolabeled with FITC-conjugated antistathmin antibodies to visualize stathmin expression (green fluorescence) and with Hoechst 33342 to visualize nuclear morphology (blue fluorescence). Large mononucleated MKs (ie, less mature with low ploidy) show uniform, intense stathmin expression throughout the cytoplasm (i, arrows). MKs with multilobulated nuclei (ie, mature MKs with higher ploidy) show an overall reduction in stathmin expression which, in some cells, is accompanied by an uneven expression pattern throughout the cytoplasm (ii-iii, arrows). Image acquisition was performed using a Zeiss Axioplan 2 microscope equipped with a 63×/1.4 oil objective and an AxiCam MRm camera (Carl Zeiss). Image analysis was performed using Zeiss AxioVision LE software.

