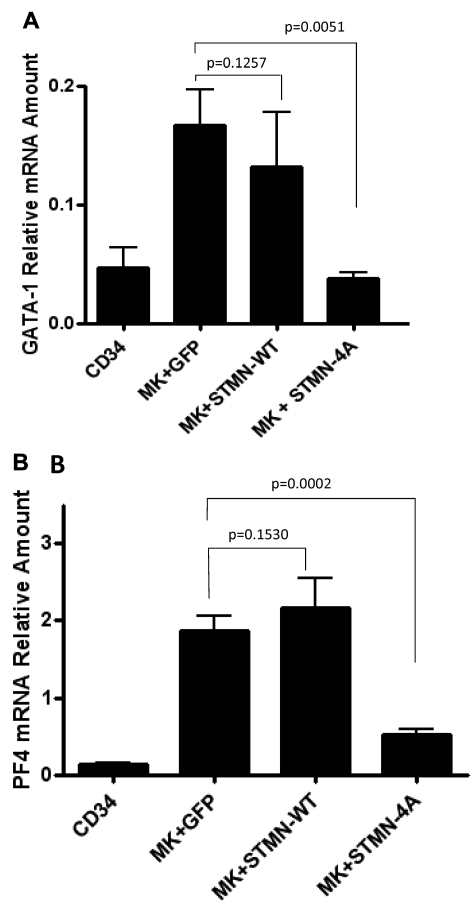
Figure 5.
Quantitative real-time PCR analysis of GATA-1 and PF4 expression. mRNAs extracted from CD34+ cells and from day 14 MKs infected with control (MK + GFP), wild-type (MK + STMN-WT), or nonphosphorylatable mutant (MK + STMN-4A) stathmin-expressing lentiviruses were reverse transcribed and then amplified by quantitative real-time PCR using human GATA-1 (A) and PF4 (B) primers. Each column represents the mean ± SD of 3 independent experiments each performed in duplicate and normalized to GAPDH.

